Who it's for — Anyone who looks at a chart and sees only a chaotic line going up and down randomly. Recognizing Highs and Lows gives a logical and mathematical order to the chaos.
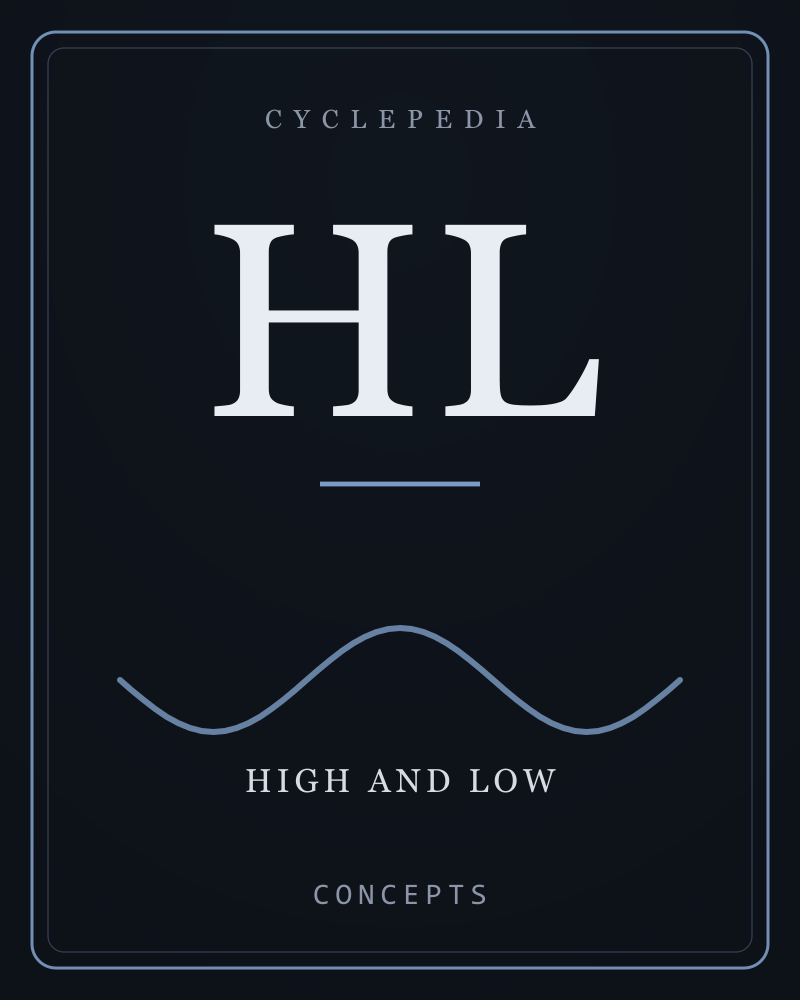
If you look closely, price almost never moves in a straight line. It moves in a zigzag. Every time it zigzags, it creates two extreme points: a point at the top and a point at the bottom.
These extreme points are called High and Low.
In simple terms — Imagine climbing a mountain range. The High is the peak of every single mountain. The Low is the deepest valley between one mountain and the next.
The Breadcrumbs of the Trend
Why do we care so much about peaks and valleys? Because they are the compass that tells us which direction the market is going.
As we saw in the lesson on Trend:
- If every peak is higher than the previous one (Higher High - HH).
- And if every valley is higher than the previous one (Higher Low - HL).
- Then you are in an Uptrend.
The exact opposite applies to downtrends (Lower Highs, Lower Lows).
Market Structure
The combination of all these highs and lows forms what professionals call Market Structure. An experienced trader doesn't look at individual green or red candles. They only look at the "points". As long as the points are pointing upwards, they keep buying.
Lows as Supports, Highs as Resistances
Every time the market creates a "valley" and restarts upwards, it means that at that level there were enough buyers to stop the fall. Therefore, every Low becomes a small, natural Support.
The same thing works in reverse: every mountain peak, where sellers took control, becomes a small, natural Resistance. When the price tries to overcome that peak in the future, it will surely find some difficulty.
Summary Sheet
- What is a High: The highest point reached before the price reverses and drops.
- What is a Low: The lowest point touched before the price reverses and rises.
- Golden Advice: Never judge a Trend by a single candle. Always look at the sequence of Highs and Lows. If the sequence is not broken, the Trend is safe.
Bronze Path — Module 2: How price moves. Next lesson: Timeframe. Return to index: bronze-path.
Links
- trend — How the sequence of highs and lows defines a Trend.
- support — How a low can become a support.
- resistance — How a high can become a resistance.
- bronze-path
Module: Module 2 — How price moves
Be able to describe a chart without inventing forecasts.